Nvidia

The company has not specified what gases are covered by its target and does not have separate targets for emissions reductions and removals. Net Zero Tracker
Furthermore, Nvidia does not have a publicly available plan that lays out steps toward its target. Net Zero Tracker
An interesting fact about Nvidia's environmental policy is that it lacks a reporting mechanism for its environmental impact. Net Zero Tracker
In addition, you can check out the net-zero commitments and data for the relevant actors:"
Current Score (vs. LY)
25.5 pts (-2.5)
Last Update: Dec. 18, 2024Greenhouse Gas Emissions
Last 3 Years Emissions Data Summary
| Y2022 | Y2021 | Y2020 | |
|---|---|---|---|
| Scope 1 | 4,612 | 2,692 | 2,817 |
| Scope 2 - location-based | 133,569 | 105,621 | 74,692 |
| Scope 2 - market-based | 78,210 | 89,048 | 65,936 |
| Scope 1-2 - location-based | 138,181 | 108,313 | 77,509 |
| Scope 1-2 - market-based | 82,822 | 91,740 | 68,753 |
| Scope 3 | 2,701,477 | 1,972,425 | 1,296,150 |
| Total - location-based | 2,839,658 | 2,080,738 | 1,373,659 |
| Total - market-based | 2,784,299 | 2,064,165 | 1,364,903 |
Note: Data sources detailed here
Performance vs. Target
Value Chain (scope 3) Emissions by Category
Emissions Trajectory (Full Scopes)
Please refer to the library for viewing the supporting documentation
Sector Benchmark
Note: Latest GHG and revenue data (based on tradingview.com) are used to calculate GHG emissions intensity by sector. The color scale of each bubble depends on the GHG intensity (GHG emissions per 1 million USD revenue). Sectors follow the Global Industry Classification Standard (GICS) that organize companies based on their primary business activities. The 11 sectors are : Information Technology, Health Care, Financials, Consumer Discretionary, Communication Services, Industrials, Consumer Staples, Energy, Utilities, Real Estate, and Materials.
Nvidia belongs to the sector Information Technology.
Reduction and Net Zero Targets
>Note: intensity targets are not represented in the current version - see Methodology
Gross Absolute Emission Reductions
There is no absolute emission reduction recorded in our database. Email us to report missing information Email
Net Absolute Emission Reductions
There is no absolute emission reduction recorded in our database. Email us to report missing information Email
Net Zero Future Commitments
There is no net zero target recorded in our database. Email us to report missing information Email
Science-based Targets (SBTI)
Date Published / Updated :2025-07-10 01:00:00
| Near-term | Long-Term | Net Zero Standard |
|---|---|---|
| Targets set : 1.5°C | No target | No |
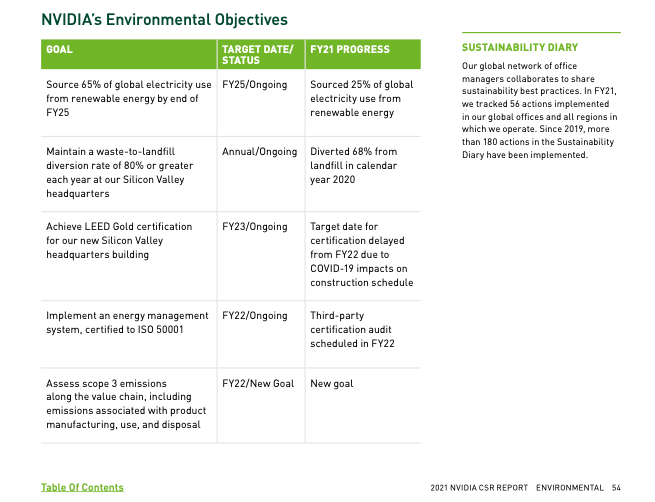
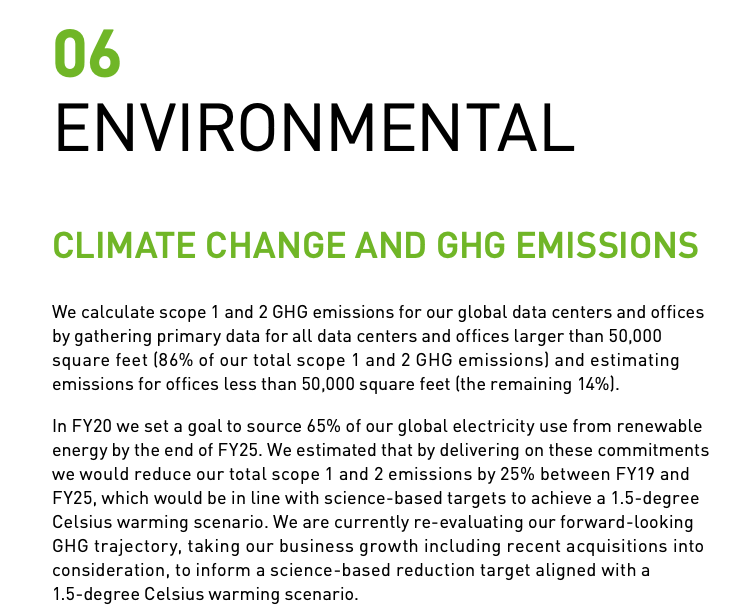
Near-Term Targets: NVIDIA commits to reduce absolute scope 1 and 2 GHG emissions 50% by FY2030 from a FY2023 base year. NVIDIA also commits to reduce scope 3 GHG emissions from use of sold products 75% per PetaFLOP within the same timeframe.
Data source: SBTIOffsets
Last update for NVIDIA by zerotracker.net: Feb. 23, 2026| Planning to use external offset credits | Not Specified |
| Separate targets for emission reductions and removals | No |
| Conditions on use of offset credits | None |
| Plans for carbon dioxide removal (CDR) | Not Specified |
Additional notes: NVIDIA's target does not allow for traded credits. https://web.archive.org/web/20250825192027/https://images.nvidia.com/aem-dam/Solutions/documents/NVIDIA-Sustainability-Report-Fiscal-Year-2025.pdf
Score Summary
| Ref | Principle |
Score
(points) |
Max
(points) |
Delta
(points) |
|---|---|---|---|---|
| 1 | At least 2 years of GHG emissions for scope 1 and 2 are publicly-available and externally-verified | 10.0 | 10.0 | 0.0 |
| 2 | Scope 3 emissions are fully reported and externally-verified | 5.0 | 10.0 | 0.0 |
| 3 | CDP score demonstrates the level of transparent disclosures | 8.0 | 10.0 | 0.0 |
| Transparency | 23.0 | 30.0 | 0.0 | |
| 4 | Net Zero Commitments by 2050 include an intermediate target and cover all the emissions | 0.0 | 10.0 | 0.0 |
| 5 | Net Zero targets demonstrate a high-level of emergency | 0.0 | 10.0 | 0.0 |
| 6 | Emission reduction targets on a forward-looking basis are ambitious | 0.0 | 10.0 | 0.0 |
| 7 | Targets are science-based as validated by SBTi | 0.0 | 10.0 | 0.0 |
| Commitments | 0.0 | 40.0 | 0.0 | |
| 8 | Results re. operational emissions reduction: on-pace (performance-to-date) and momentum (forward-looking targets) | 0.0 | 10.0 | 0.0 |
| 9 | Results re. value chain emissions reduction: on-pace (performance-to-date) and momentum (forward-looking targets) | 0.0 | 10.0 | 0.0 |
| 10 | Implied Temperature Rating by MSCi | 2.5 | 10.0 | -2.5 |
| Results | 2.5 | 30.0 | -2.5 | |
| Total | 25.5 | 100.0 | -2.5 |
Score Details
| Criteria | Results | 2024 Score | 2023 Score | Vs. 2023 | 2022 Score |
|---|---|---|---|---|---|
| Criteria 1 : Transparency on operational emissions (Scope 1 + 2) | |||||
| Are S1+S2 figures publicly-disclosed for the last reporting year and the preceding period? | yes | 5.0 / 5.0 | 5.0 | 0.0 | 5.0 |
| Are S1+S2 figures verified by a 3rd-party for the last reporting year? | yes | 5.0/ 5.0 | 5.0 | 0.0 | 5.0 |
| Criteria 2 : Transparency on value chain emissions (Scope 3) | |||||
| Are the 15 categories fully or partly disclosed? | partly | 2.5 / 5.0 | 2.5 | 0.0 | 2.5 |
| Are S3 figures fully or partly verified by a 3rd-party for the last reporting year? | partly | 2.5 / 5.0 | 2.5 | 0.0 | 2.5 |
| Criteria 3 : Quality and Frequency of reporting | |||||
| What is the latest CDP score (no later than the preceding year)? | B | 8.0 / 10.0 | 8.0 | 0.0 | 8.0 |
| How many interim reporting were provided between 2 reporting periods (GHG emissions only)? | |||||
| Criteria 4 : Net Zero Commitments | |||||
| Does the net 0 target include a statement of a generally-accepted net zero emission target by 2050? | NC | 0.0 / 3.0 | 0.0 | 0.0 | 0.0 |
| Does the net zero target include an intermediate target by 2030? | NC | 0.0 / 3.0 | 0.0 | 0.0 | 0.0 |
| Does the net zero target include all the emissions? | NC | 0.0 / 4.0 | 0.0 | 0.0 | 0.0 |
| Criteria 5 : Target year for Net Zero Commitments | |||||
| Target year for achieving net zero emissions for S1+S2? | NC | 0.0 / 5.0 | 0.0 | 0.0 | 0.0 |
| Target year for achieving net zero emissions for S1+S2+S3 combined? | NC | 0.0 / 5.0 | 0.0 | 0.0 | 0.0 |
| Criteria 6 : Reduction objectives | |||||
| What is the forward-looking GHG% reduction (without compensation) for scope 1+2? | 0.0 / 5.0 | 0.0 | 0.0 | 0.0 | |
| What is the forward-looking GHG% reduction (without compensation) for scope 1+2+3? |
No target found
|
0.0 / 5.0 | 0.0 | 0.0 | 0.0 |
| Criteria 7 : Science-Based Targets | |||||
| What type of science-based target (as validated by SBTi) did the company commit to? | NC | 0.0 / 10.0 | 0.0 | 0.0 | 0.0 |
| Criteria 8 : Results based on scope 1 - 2 | |||||
| Performance to date: cumulative% reduction vs. target |
Objective (in %):
Actual (in %): No target found
|
0.0 / 5.0 | 0.0 | 0.0 | 0.0 |
| Momentum: last year % reduction vs. forward-looking target |
Objective (in %):
Actual (in %): No target found
|
0.0 / 5.0 | 0.0 | 0.0 | 0.0 |
| Criteria 9 : Results based on scope 1 - 2 - 3 | |||||
| Performance to date: cumulative% reduction vs. target |
Objective (in %):
Actual (in %): No target found
|
0.0 / 5.0 | 0.0 | 0.0 | 0.0 |
| Momentum: last year % reduction vs. forward-looking target |
Objective (in %):
Actual (in %): No target found
|
0.0 / 5.0 | 0.0 | 0.0 | 0.0 |
| Criteria 10 : Implied Temperature Rise (ITR) | |||||
| Is the company aligned with global climate targets? | ITR: 2.7°C | 2.5 / 10.0 | 5.0 | -2.5 | 5.0 |
| Total | 25.5 / 100.0 | 28.0 | -2.5 | 28.0 | |
Available Data Sources
| Reporting Year | 2022 | 2021 | 2021 | 2021 | 2021 | 2020 | 2020 | 2020 | 2020 | 2019 |
|---|---|---|---|---|---|---|---|---|---|---|
| Source | Public | Public | Yourstake | CDP | Public | Public | CDP | Public | CDP | Public |
| Publication Year | 2022 | 2022 | 2022 | 2021 | 2021 | 2022 | 2021 | 2021 | 2020 | 2021 |
| Scope 1 | 4,612 | 2,692 | 4,612 | 2,692 | 2,692 | 2,817 | 2,819 | 2,817 | 2,817 | 2,675 |
| Scope 2 - location-based | 133,569 | 105,621 | 133,569 | 105,621 | 105,621 | 74,692 | 97,143 | 74,692 | 74,692 | 65,107 |
| Scope 2 - market-based | 78,210 | 89,048 | 78,210 | 89,048 | 89,048 | 65,936 | 88,087 | 65,936 | 65,936 | 60,093 |
| Scope 1-2 - location-based | 138,181 | 108,313 | 138,181 | 108,313 | 108,313 | 77,509 | 99,962 | 77,509 | 77,509 | 67,782 |
| Scope 1-2 - market-based | 82,822 | 91,740 | 82,822 | 91,740 | 91,740 | 68,753 | 90,906 | 68,753 | 68,753 | 62,768 |
| Scope 3 | 2,701,477 | 1,972,425 | 2,701,477 | 2,074,450 | 2,074,630 | 1,296,150 | 0 | 1,341,211 | 415,193 | 1,862,357 |
| Total - location-based | 2,839,658 | 2,080,738 | 2,839,658 | 2,182,763 | 2,182,943 | 1,373,659 | 99,962 | 1,418,720 | 492,702 | 1,930,139 |
| Total - market-based | 2,784,299 | 2,064,165 | 2,784,299 | 2,131,696 | 2,166,370 | 1,364,903 | 90,906 | 1,364,903 | 456,061 | 1,925,125 |
Sources
- CDP: Data from CDP Climate Change Questionnaire - see CDP website
- Yourstake: Data from YourStake.org - see Free SFDR data library
Please refer to the library for viewing the supporting documentation